EEG P300 Dataset
Description
The dataset includes data from 15 participants, with 7 sessions each. It represents the complete EEG recordings of a feasibility clinical trial (clinical-trial ID: NCT02445625 — clinicaltrials.gov) that tested a P300-based Brain Computer Interface to train youngsters with Autism Spectrum Disorder to follow social cues (Amaral et. al, 2017; Amaral et al., 2018).
A further description of the experimental setup and design can be found at the bottom.
Possible usecases
The detection of the P300 signal is the base of a specific type of Brain-Computer Interface (BCI) that explores the fact that paying attention to a specific, rare, stimulus among several others generates a positive peak in the EEG signal around 300ms after the stimulus onset, while the stimuli the user is not paying attention to do not generate such signal. For example, if one is looking for a light turning on and off with the color red, if some (few) times the light turns on with the color blue, the brain responds to this infrequent event with a P300 signal. A discrimination is achieved by having the different stimuli appearing at different timings, so when the P300 is detected it can be matched to the stimulus that elicited it. Due to low signal-to-noise ratio, average of several segments must be performed for a P300 to be visible to the naked eye. BCI algorithms objective is to identify the P300 using as few repetitions as possible, towards the ideal scenario of using only one segment (single-trial classification).
Dataset organisation
The dataset is divided into two parts: train and test sets. Both dataset are available with labels. The use case is to predict the labels for each block of the dataset.
A structure of a block is described in Fig. 2.

Fig. 2. Block structure: the objective is to identify the target object of each block. For that, participant can take advantage of the repetition of runs. In each of the N runs of the block, there are 8 segments of EEG, one of those containing the P300 signal.
The number of runs per block is 10 for the train set but it varies for the test set across subjects and sessions. The number of runs per block of each session is provided in the file “runs_per_block.txt” in the folder of each session, and is constant for that session.
Train set
The train set consists of the calibration phase each session. The true labels are available to train the models.
Test set
The test set consists of the online phase of each session, without the true labels. The number of runs used on the online data varies between sessions.
Each session folder is organized with the following contents:
Train\
trainData.mat
trainEvents.txt
trainTargets.txt
trainLabels.txt
Test\
testData.mat
testEvents.txt
runs_per_block.txt
Experimental Setup
The setup has two main components: i. Data acquisition module and and ii. Stimuli and Feedback presentation.
Data acquisition module
To record EEG data we used the g.Nautilus (gTEC, Austria). The equipment has 16 active electrodes that do not require abrasive skin treatment and with completely wireless signal transmission. The EEG data were acquired from 8 electrodes positions (C3, Cz, C4, CPz, P3, Pz, P4, POz), the reference was placed at the right ear and the ground electrode at AFz. Sampling rate was set at 250Hz. Data were acquired notch filtered at 50Hz and passband filtered between 2 and 30Hz.
Stimuli and Feedback presentation
To train and execute the task proposed, we use the Vizard toolkit to visualize the virtual environment consisting of a bedroom with common type of furniture (shelves, a bed, a table, a chair, and a dresser) and objects (frames, books, lights, a printer, a radio, a ball, a door, a window, and a laptop).
The objects used throughout the experiment, and their respective labels, were:
1. books on a shelf, 2. a radio on top of a dresser, 3. a printer on a shelf, 4. a laptop on a table, 5. a ball on the ground, 6. a corkboard on the wall, 7. a wooden plane hanging from the ceiling, and 8. a picture on the wall.
The virtual environment was presented via the Oculus Rift Development Kit 2 headset (from Oculus VR).
Experimental design overview
Calibration
Consist of 20 blocks. Each block contains 10 runs of the experimental condition: Each one of the 8 objects in the scene flashed (green flashes) in a randomized order (Figure 1). The highlight (flash) of each object occurred with a Interstimulus Interval of 200 ms. Each flash had the duration of 100 ms. The total number of ‘events’ per block is 80 (8 per run).
Instruction and P300
The target object in each block was selected based on pseudorandom number generator Mersenne Twister algorithm (i.e. 1 to 8). The participants were informed by the experimenter of the target object and instructed to count the number of times the target object would flash.
This protocol creates a rare event (target event probability of 1/8), thus generating a P300 brain response. At the end of each run, the participants were asked to confirm the object (behavioural control).
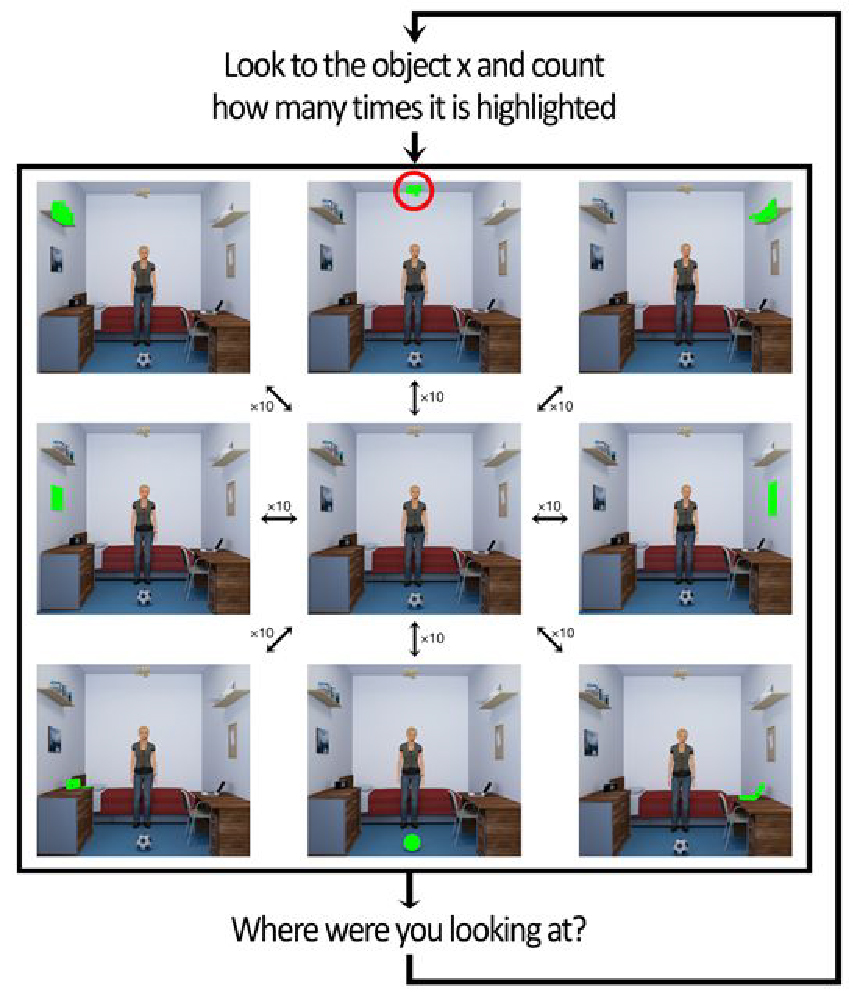
Figure 1 – BCI training phase
Calibration phase (with a total of 1600 events (200 target, 1400 non-target)) is used to optimize the number of runs used to classify the target object during the online phase (i.e. the number of runs is specific for each session, ranging from 3 to 10). The participant had an interval in the middle of the calibration phase.
Online phase
In the online phase of BCI (figure 2), we have a total of 50 blocks. Each block is composed by a number of runs previously selected based on the calibration phase. The structure of each run is similar to the calibration phase.
The total number of events is session-specific and is determined by the number of blocks(50)*number of runs( calibration≠dependent†)*number of events(8).
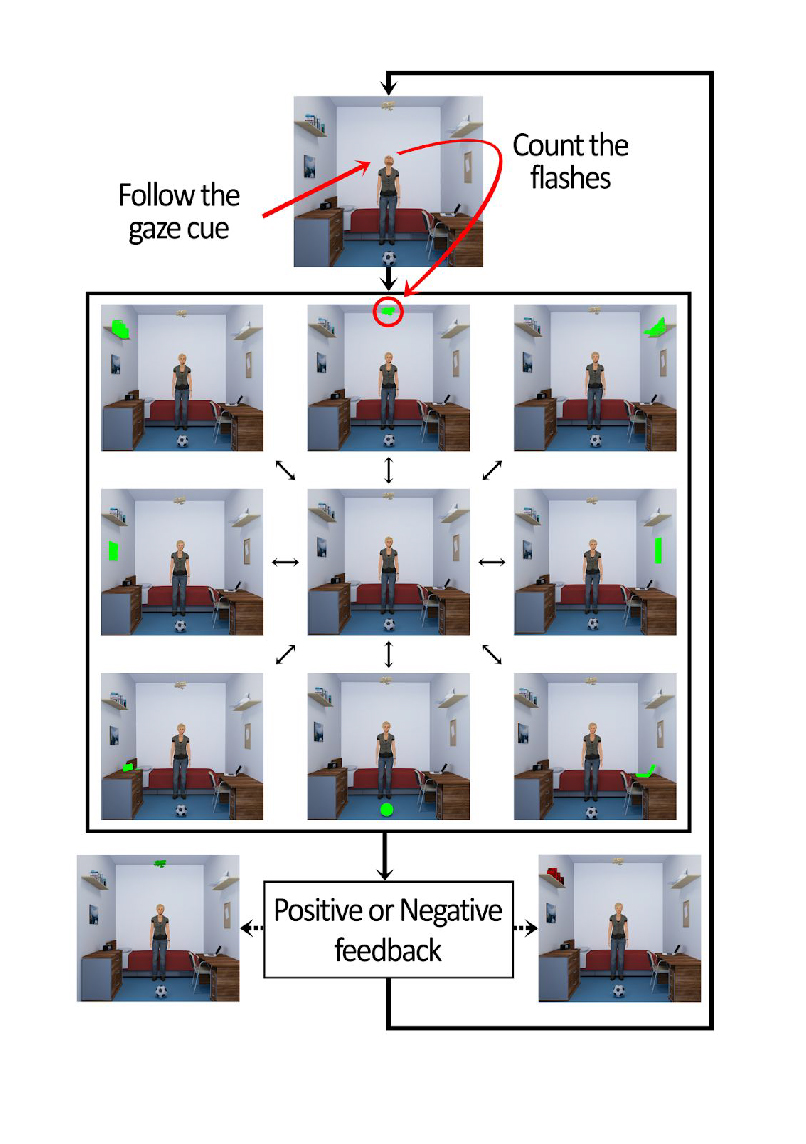 Figure 2 – Online phase of BCI

Access:
This database is available to logged users using the link below.
How to cite this database:
Amaral, C. P., Simões, M. A., Mouga, S., Andrade, J., & Castelo-Branco, M. (2017). A novel Brain Computer Interface for classification of social joint attention in autism and comparison of 3 experimental setups: A feasibility study. Journal of Neuroscience Methods, 290, 105–115.
Amaral, C., Mouga, S., Simões, M., Pereira, H.C., Bernardino, I., Quental, H., Playle, R., McNamara, R., Oliveira, G. and Castelo-Branco, M., 2018. A feasibility clinical trial to improve social attention in autistic spectrum disorder (ASD) using a brain computer interface. Frontiers in neuroscience, 12, p.477.
Contact us
This dataset was used in the support of:
MEDICON 2019 IFMBE Scientific Challenge